
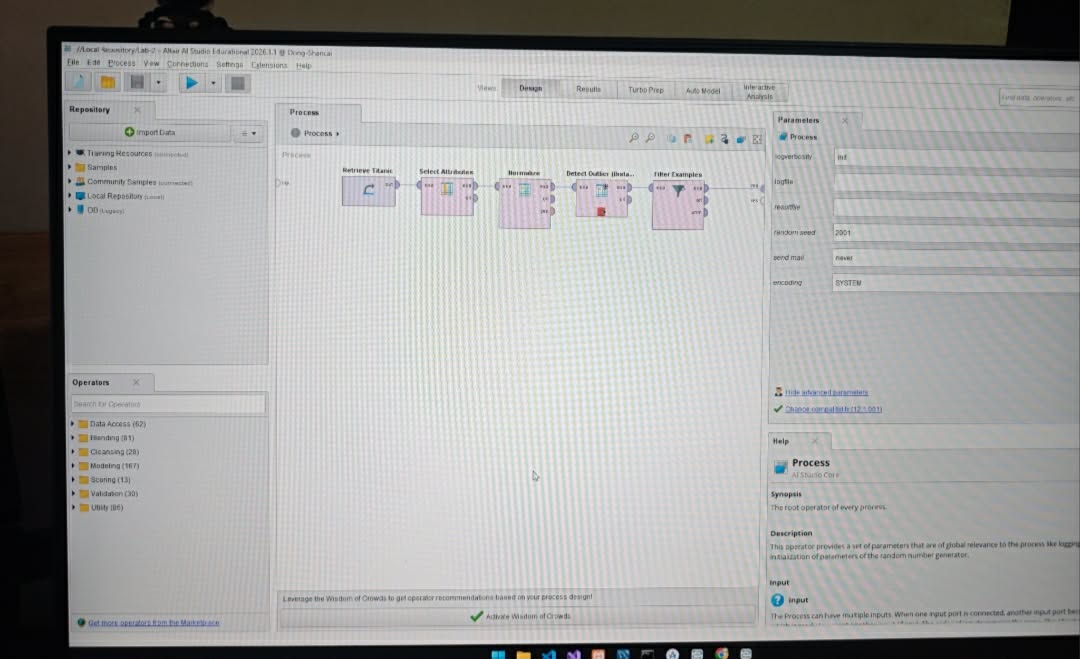
Learning RapidMiner was a new experience for me as an IT student. Unlike traditional programming tools, RapidMiner allowed me to create a data analysis process by dragging, dropping, and connecting operators.
My activities focused on the Titanic dataset. This dataset contains information about passengers, including their age, gender, passenger class, ticket details, and whether they survived. Working with this dataset helped me understand how raw information can be prepared, examined, and transformed into useful results.
Understanding the RapidMiner Interface
When I first opened RapidMiner, the number of panels, operators, ports, and settings was confusing. I needed time to understand the purpose of each part of the interface.
The Design view is where a data process is created. This is where I placed operators and connected them. The Results view displayed the output after I ran the process.
I also learned about the repository, which stores datasets and saved processes. Instead of opening the original file repeatedly, I could save the Titanic dataset in the repository and retrieve it whenever I needed it.
Understanding these areas made it easier for me to follow the succeeding exercises.
Building My First Process
My first step was retrieving the Titanic dataset from the repository. I added a Retrieve operator to the process and selected the saved dataset.
The operator contained an output port that needed to be connected to the result port of the process. At first, I did not fully understand why the ports needed to be connected.
I eventually learned that the connections control how data moves through the process. One operator receives the data, performs an action, and sends the result to another operator.
If a required port is not connected, the process may not run or may not display the expected result. Learning to check every connection became an important part of my workflow.
Examining the Titanic Dataset
After successfully running the process, I opened the Results view and examined the Titanic passenger records.
The dataset contained several attributes that could be used for analysis. Each row represented a passenger, while the columns represented information about that passenger.
I checked the number of records, attribute names, data types, and missing values. This taught me that it is important to understand a dataset before making changes to it.
If I immediately apply operators without examining the data, I may remove important information or produce an incorrect result.
Selecting Important Attributes
One of my exercises involved choosing which attributes should remain in the dataset. Some analyses do not require every available column.
I used an operator for selecting attributes and configured which columns should be included or excluded. After running the process, I compared the output with the original data.
This activity showed me how removing unnecessary attributes can make a dataset easier to understand. It can also help focus the analysis on the information connected to a specific question.
However, I learned that attributes should not be removed without a reason. A column that appears unimportant at first may still affect the final analysis.
Filtering Passenger Records
I also practiced filtering examples based on specific conditions. Filtering made it possible to view only the passenger records that met the rules I selected.
After applying a filter, I compared the number of records before and after the operator. The reduced number confirmed that the condition had been applied.
This helped me understand how data analysts can focus on a particular group without manually checking every row. The same idea could be applied to business records, student information, attendance data, sales transactions, and many other datasets.
I learned to check the condition carefully because one incorrect operator or value could produce an empty or misleading result.
Handling Missing Values
Real datasets are not always complete. Some Titanic passenger records contained missing information, which could create problems during analysis.
I practiced using an operator that handles missing values. Depending on the data and the purpose of the analysis, missing values may be replaced, ignored, or removed.
This activity taught me that missing data should not be handled randomly. Replacing every missing value with zero, for example, may change the meaning of the dataset.
Before selecting a method, I need to check which attribute is missing information and consider how the decision could affect the results.
Using Breakpoints to Inspect the Process
One of the most useful RapidMiner features I learned was the breakpoint.
A breakpoint temporarily pauses a process before or after a selected operator. It allows me to inspect the dataset at a particular stage instead of waiting until the entire process finishes.
I used a breakpoint to compare the number of records before and after an operation. This helped me confirm whether the operator was changing the data correctly.
At first, I expected the process to finish immediately. When it paused, I thought something was wrong. I later understood that I needed to inspect the intermediate result and then resume the process.
Breakpoints are valuable for troubleshooting because they make it easier to identify exactly where an unexpected change happens.
Checking the Results
Running a process successfully does not automatically mean that the result is correct.
After every activity, I checked the Results view and compared the output with the instructions. I examined the remaining attributes, number of records, data types, and values produced by each operator.
I learned to ask several questions:
- Did the expected attributes remain?
- Did the number of records change correctly?
- Were missing values handled properly?
- Did the filtering condition produce the intended group?
- Was the final operator connected to the result port?
- Did the process display warnings or errors?
These checks helped me avoid submitting an output simply because the process completed without an error.
Problems I Encountered
Several parts of RapidMiner were difficult for me at the beginning.
I sometimes connected an operator to the wrong port or forgot to connect the final output to the result port. There were also times when the process displayed a different number of records from what I expected.
I had to return to the Design view, inspect each operator, review its parameters, and run the process again.
I also experienced confusion when working with breakpoints. The process paused as intended, but I initially did not know that I had to continue or resume it to see the final result.
These mistakes taught me to troubleshoot the process one operator at a time instead of changing everything together.
What RapidMiner Taught Me About Data Analysis
RapidMiner helped me understand that data analysis is a process rather than a single action.
A typical workflow may involve retrieving the data, examining its quality, selecting useful attributes, handling missing values, filtering records, and checking the final result.
The visual interface made it easier to see how each step affected the next one. Even without writing a large amount of code, I still needed to think carefully about the logic of the process.
The software performs the operation, but the user remains responsible for selecting the correct method and interpreting the result.
How I Can Apply These Skills
The skills I practiced with the Titanic dataset can also be applied to other projects.
For example, a school could analyze student attendance or academic performance. A business could examine sales records, customer behavior, or inventory data. A website owner could study traffic and visitor activity.
The dataset may change, but many of the preparation steps remain similar. The data must be collected, cleaned, organized, processed, and interpreted carefully.
My Next Learning Goals
After completing my first RapidMiner activities, I want to learn more about:
- Data cleaning and transformation
- Descriptive statistics
- Data visualization
- Classification models
- Clustering
- Model training and testing
- Performance evaluation
- Understanding prediction results
I also want to practice with other datasets so I do not depend only on the Titanic example.
Conclusion
My first experience with RapidMiner taught me how visual operators can be combined to create a complete data analysis process.
I learned how to retrieve a dataset, connect operator ports, select attributes, filter records, handle missing values, use breakpoints, and inspect results. I also learned that a successful process must still be checked carefully to ensure the result makes sense.
RapidMiner felt confusing when I first used it, but each exercise made the interface easier to understand. I still need more practice, but I now have a stronger foundation in data preparation and analysis.
This experience reminded me that mistakes are a normal part of learning a new tool. By checking each step and understanding how the data changes, I can continue improving my data analytics skills.
Pingback: Welcome to My IT Student Learning Journey - domingocelso.site